
Multivariate Control Charts for Manufacturing Processes with Multivariate Data and Their Applications
Keywords:
Quality Characteristics, Multivariate Data, Multivariate Control Charts, Univariate Control Charts, Out-Of-Control Signal, False AlarmAbstract
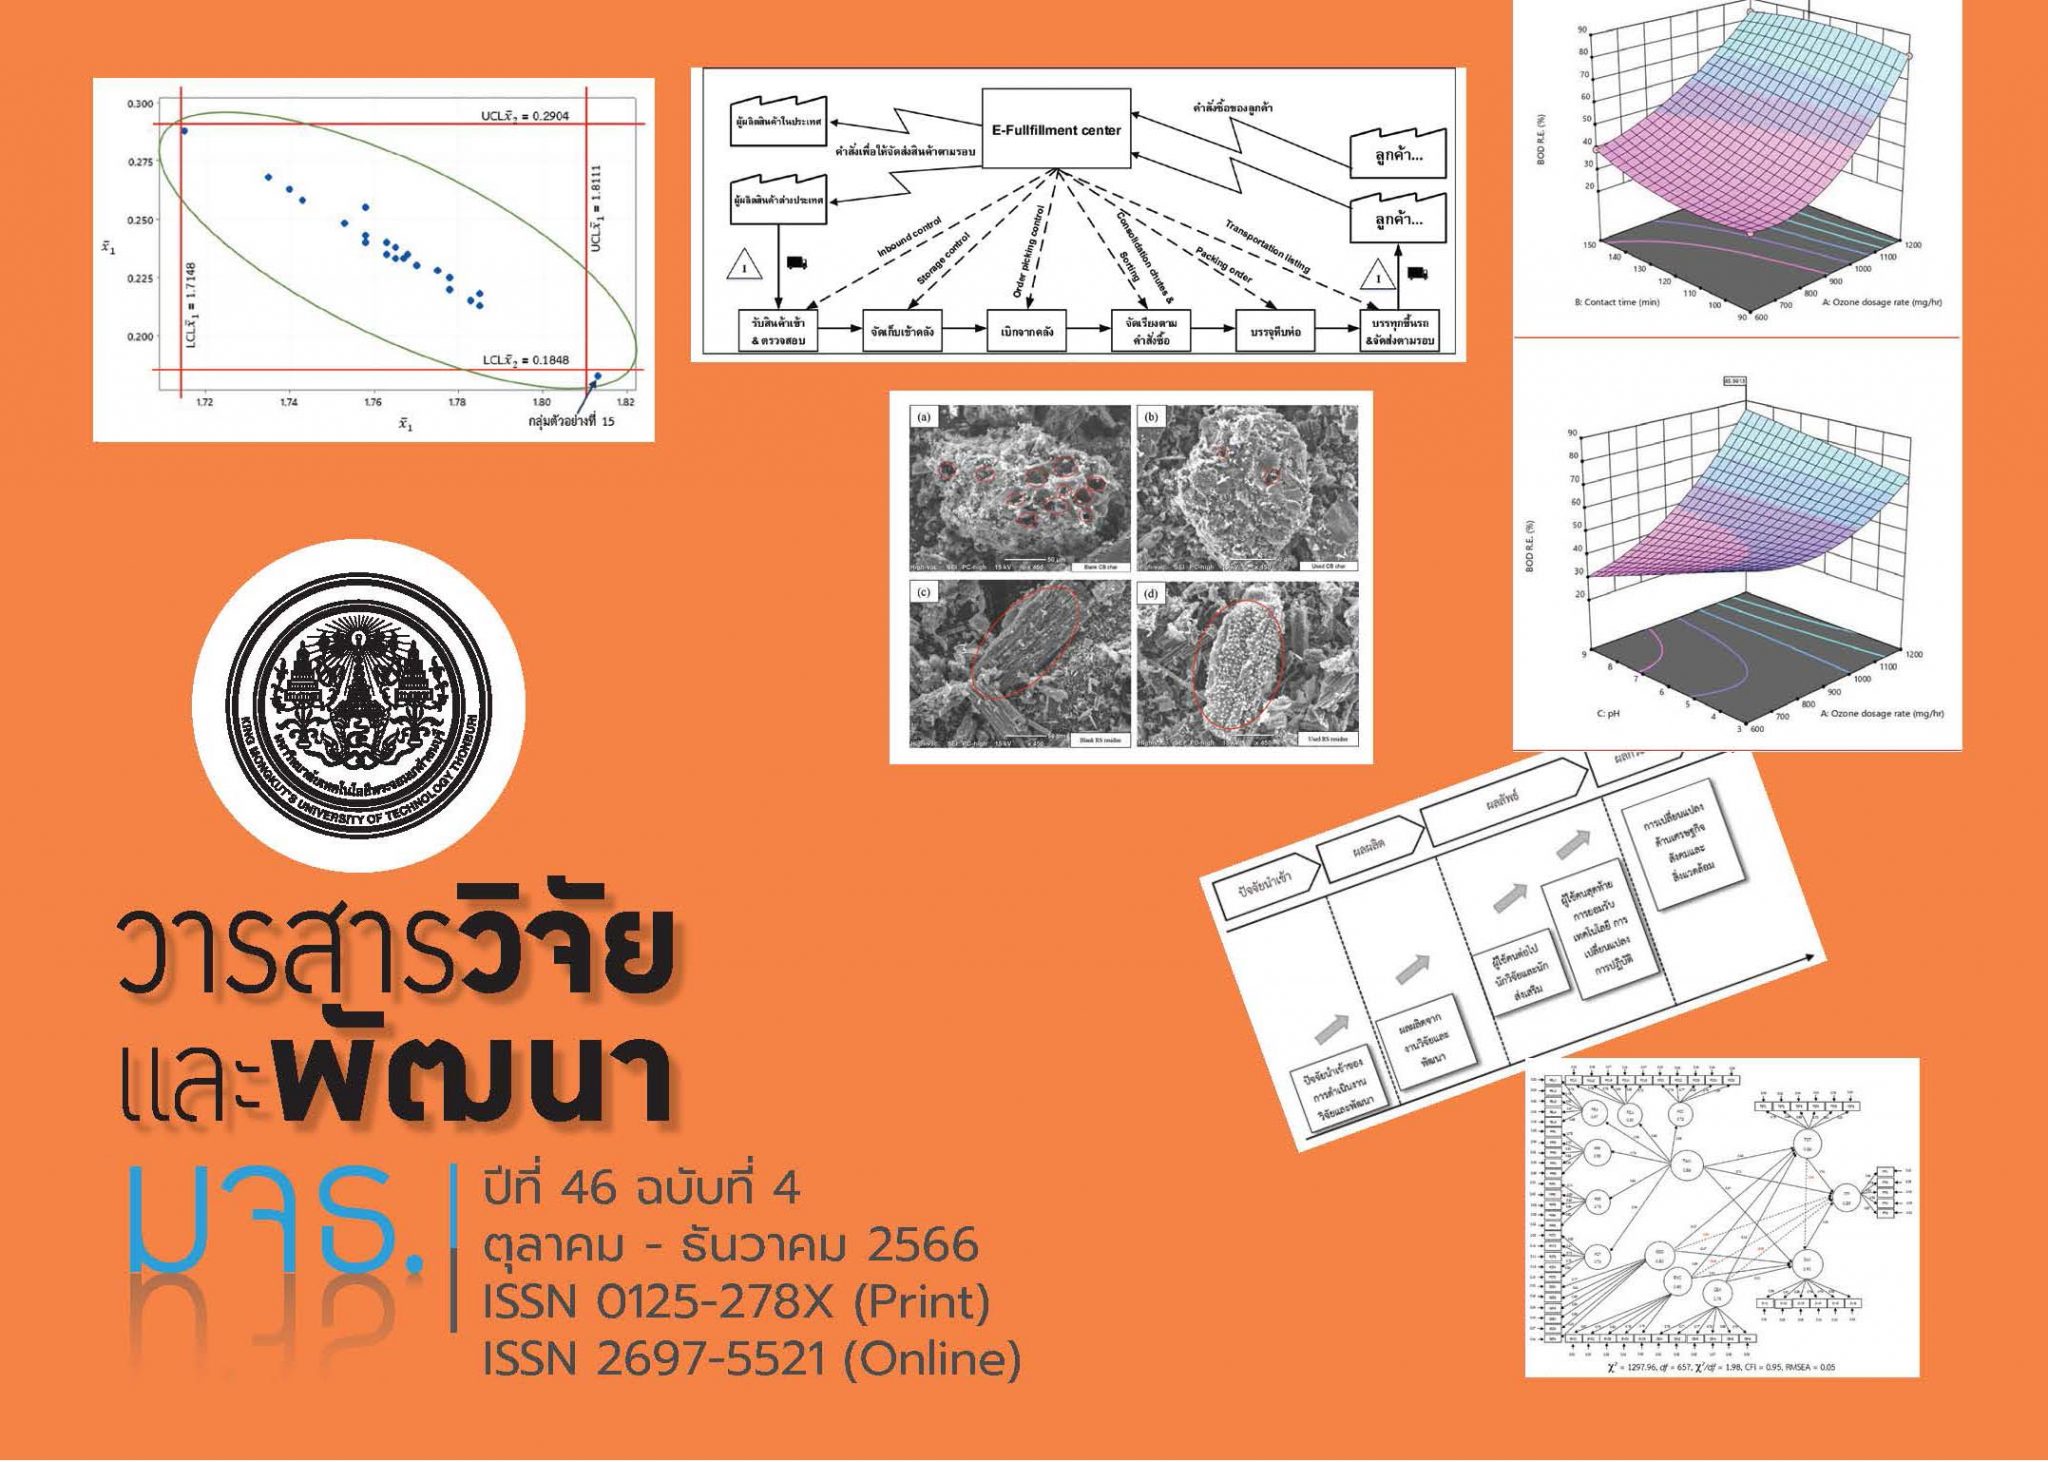
Quality of individual units of a product from any given production process usually consists of more than one characteristics, which are considered to be a set of multivariate data in nature. Multivariate data analysis therefore seems to be more appropriate for this type of data. However, its use is not common in industrial settings. For example, implementation of multivariate control charts to analyze the status of a production process involves relatively complex computations, thus creating a barrier to practitioners who normally prefer simpler univariate control charts even when the latter is less efficient. This article aimed to present an experimental implementation of multivariate control charts by relying on case studies for illustrating the tools and to compare the results of using univariate control charts in the same case studies. The results of the comparison revealed that the use of multivariate control charts for multivariate processes provided a more accurate analysis of the state of the processes than using univariate control charts. In addition, a practical method to determine which of the monitored variables exhibited responsibility for out-of-control signals on the multivariate control charts is presented.
References
Montgomery, D., 2009, Introduction to Statistical Quality Control, 6th ed., John Wiley & Sons, New York, p. 734.
Hotelling, H., 1947, “Multivariate Quality Control –Illustrated by the Air Testing of Sample Bombsights,” pp. 111–184, in C. Eisenhart, M.W. Hastay and W.A. Wallis (Eds.) Techniques of Statistical Analysis, McGraw-Hill, New York.
Barthus, R.C. and Poppi, R.J., 2002, “Multivariate Quality Control Applied to Detect the Soybean Oil Oxidation Using Fourier Transform Infrared Spectroscopy,” Spectroscopy Letters, 35 (5), pp. 729–739.
Nugraha, J, Fatimah, I. and Prabowo, R.G., 2017, “Control of Wastewater Using Multivariate Control Chart,” International Conference on Chemistry, Chemical Process and Engineering (IC3PE) 2017, 15-16 November 2016, Yogyakarta, Indonesia, pp. 020126-1–020126-11.
Chou, Y.M., Mason, R.L. and Young, J.C., 2001, “The Control Chart for Individual Observations from a Multivariate Non-Normal Distribution,” Communications in Statistics - Theory and Methods, 30 (8-9), pp. 1937-1949.
Kalgonda, A.A. and Kulkarni, S.R., 2004, “Multivariate Quality Control Chart for Autocorrelated Processes,” Journal of Applied Statistics, 31 (3), pp. 317–327.
Tantibadaro, V., 2004, Loss-Function-Based Control Chart for AR (1) Processes, Doctor of Engineering Dissertation, Industrial Systems Engineering, School of Advanced Technologies, Asian Institute of Technology, 137 p.
Alt, F.B., 1985, “Multivariate Quality Control,” pp. 110–122, in N.L. Johnson and S. Kotz (Eds.) Encyclopedia of Statistical Sciences, Vol. 6, Wiley, New York.
Jackson, J.E., 1980, “Principal Components and Factor Analysis: Part I-Principal Components,” Journal of Quality Technology, 12 (4), pp. 201–213.
Runger, G.C., Alt, F.B. and Montgomery, D.C., 1996, “Contributors to a Multivariate Statistical Process Control Signal,” Communications in Statistics-Theory and Methods, 25 (10), pp. 2203–2213.
Downloads
Published
How to Cite
Issue
Section
License
Copyright (c) 2023 King Mongkut's University of Technology Thonburi

This work is licensed under a Creative Commons Attribution-NonCommercial-NoDerivatives 4.0 International License.
Any form of contents contained in an article published in Science and Engineering Connect, including text, equations, formula, tables, figures and other forms of illustrations are copyrights of King Mongkut's University of Technology Thonburi. Reproduction of these contents in any format for commercial purpose requires a prior written consent of the Editor of the Journal.

